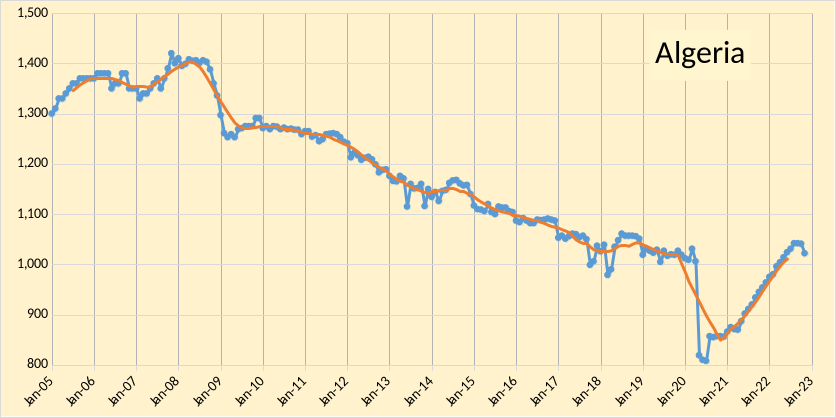
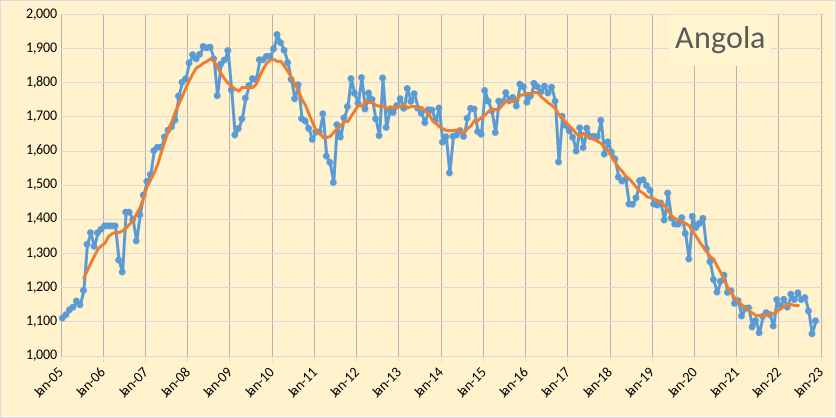
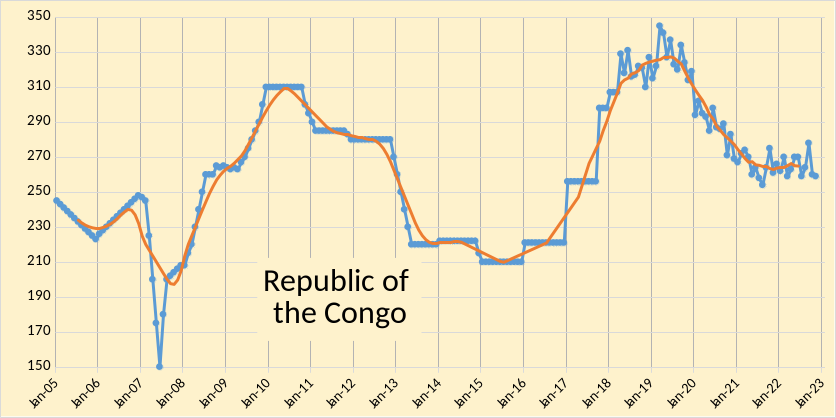
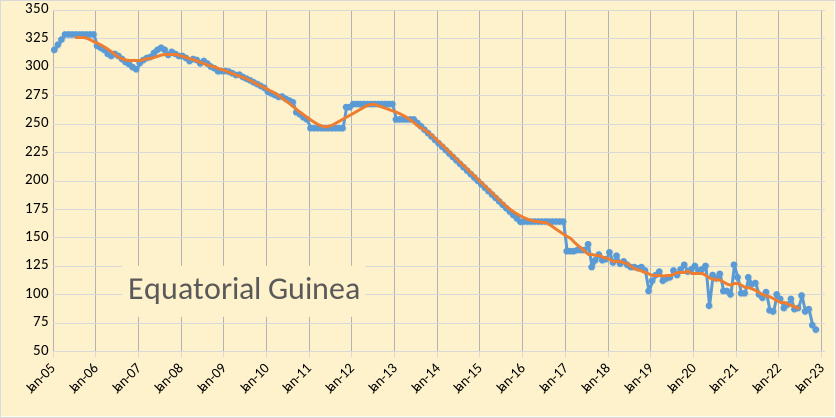
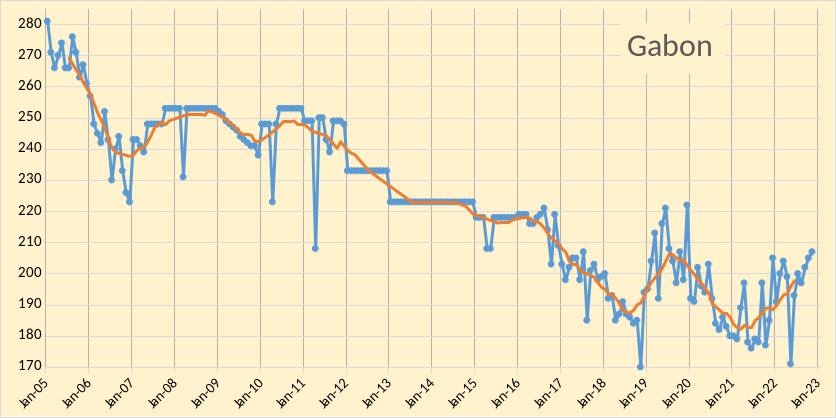
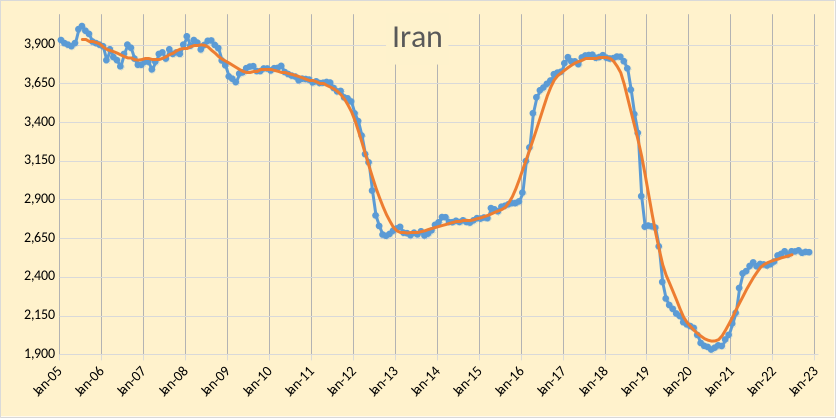
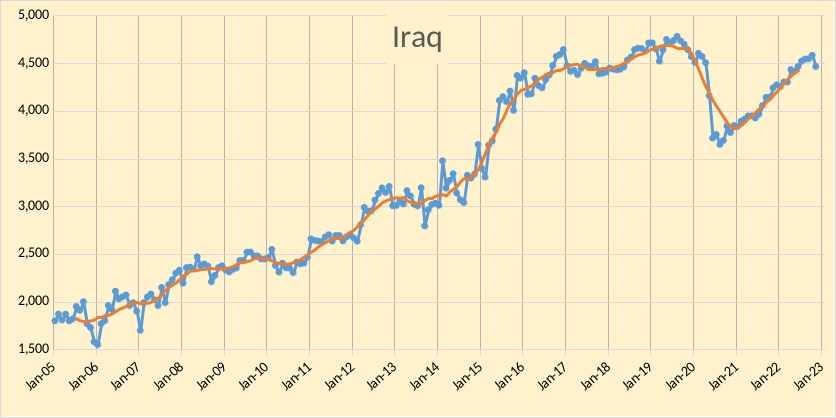
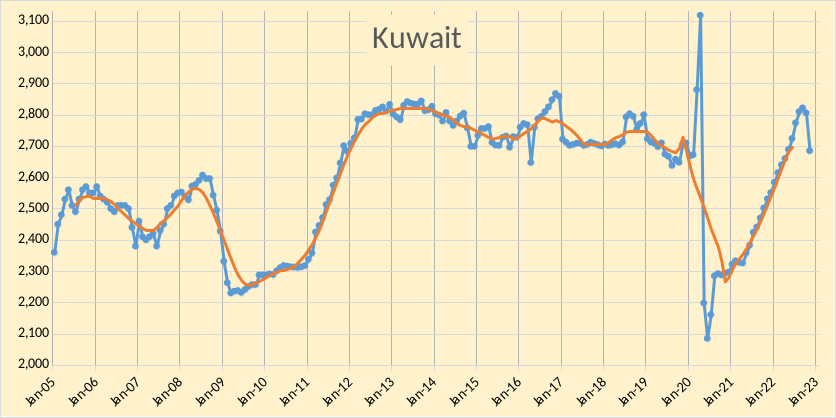
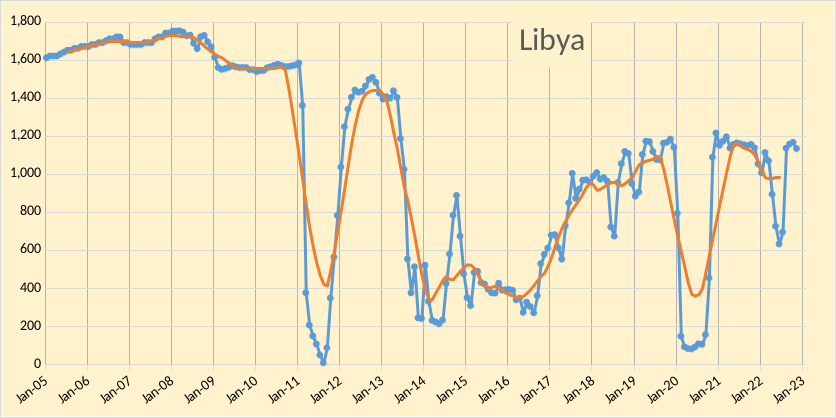
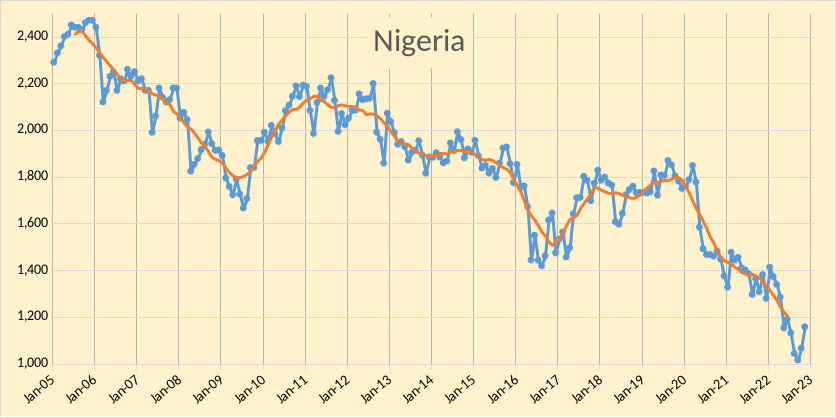
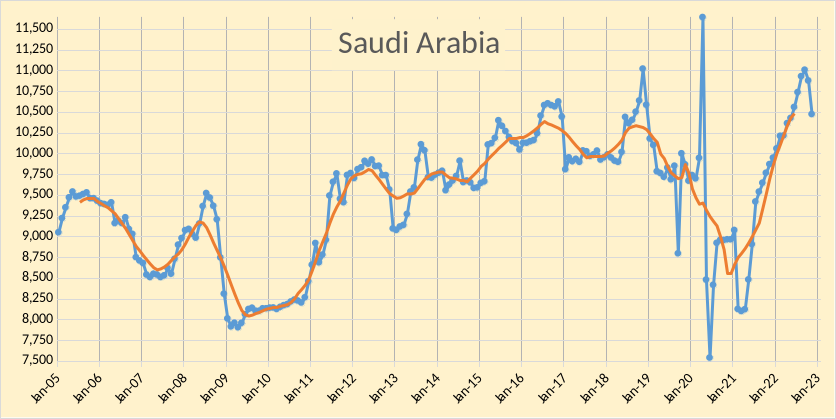
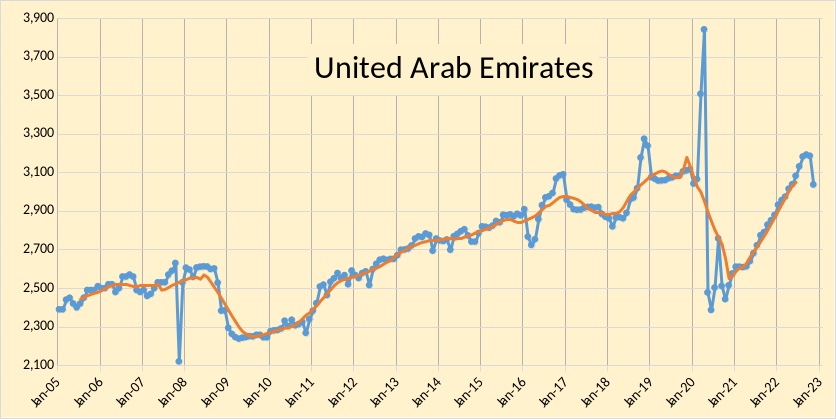
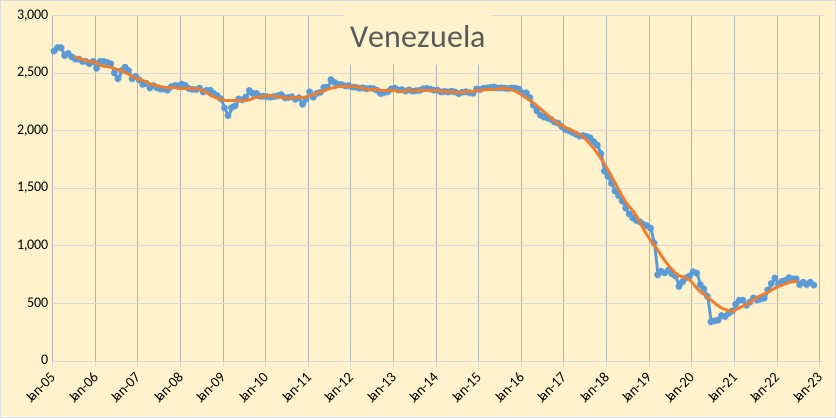
The OPEC Monthly Oil Market Report (MOMR) for December 2022 was published recently. The last month reported in most of the OPEC charts that follow is November 2022 and output reported for OPEC nations is crude oil output in thousands of barrels per day (kb/d). In most of the OPEC charts that follow the blue line is monthly output and the red line is the centered twelve month average (CTMA) output.
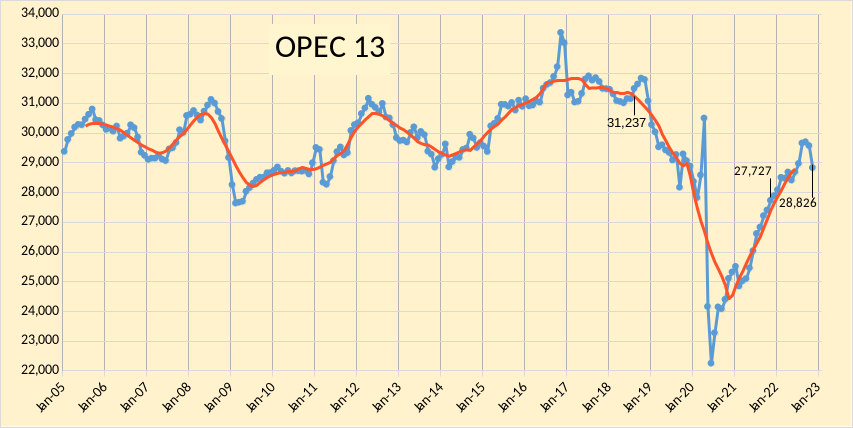
OPEC crude output was revised lower in September 2022 by 8 kb/d compared to last month’s report and October 2022 OPEC crude output was revised higher by 76 kb/d. OPEC output has increased by 1099 kb/d since Nov 2021, from 27727 kb/d to 28826 kb/d. When the World was at its centered twelve month average peak for C+C output in August 2018, OPEC crude output was 31237 kb/d (as shown on the chart), November OPEC crude output was 2411 kb/d below that level.
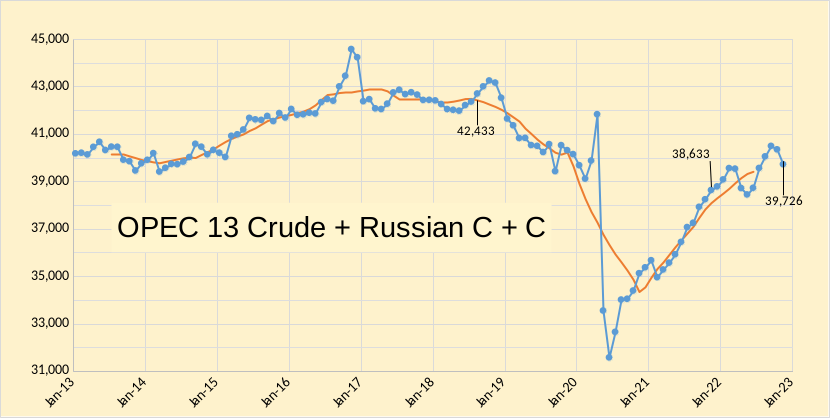
In the chart below we have Russian C + C and OPEC crude oil output. Output for OPEC13 crude and Russian C+C was 42433 kb/d in August 2018 when World C+C output was at its centered 12 month average peak, output for Russia and OPEC was 2707 kb/d below the August 2018 level at 39726 kb/d in November 2022. In the past 12 months OPEC and Russian output has increased by 1093 kb/d from 38633 kb/d in November 2021.
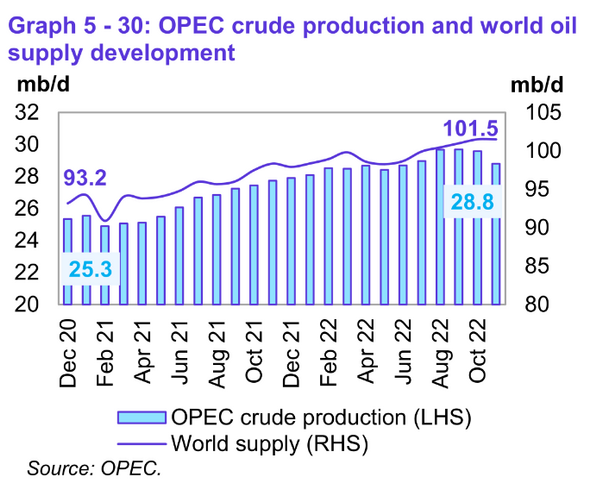
World Oil Suppy (all liquids) was 101.5 Mb/d in November 2022, 8.3 Mb/d higher than output in December 2020, OPEC crude oil output increased by 3.5 Mb/d over the same 23 month period.
OPEC expects the balance of supply and demand to be pretty close to the the November 2022 OPEC output level of 28.83 Mb/d from 2022Q4 to 2023Q2. If OPEC’s estimates for future supply and demand are correct we might expect oil prices to be fairly subdued in 2023, perhaps in the $70-90/bo range for Brent crude.
The chart below makes a guess at World stock levels of about 8000 Mb for the end of 2019Q4, the oil market was fairly balanced in 2019 with little stock change though the exact stock level is unknown because non-OECD stocks are not reported. Note that the actual level is less important than the change in the level of World stocks of oil, the actual level at the end of 2019 might have been anywhere from 8000 to 9000 barrels of petroleum products plus crude (including oil travelling in tankers). I assume for this scenario that OPEC output remains at the November 2022 level from 2022Q4 to 2023Q4 (future output is obviously not known) and see what would happen to World stocks in this scenario using OPEC’s expectation for future oil demand and Non-OPEC output. The projection starts in 2022Q4.
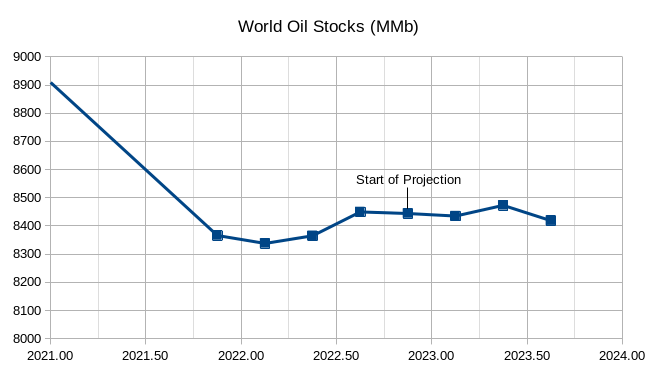
Note that stocks rise from 2022Q1 to 2022Q3, this is part of the reason for the OPEC cuts, from their perspective the market is well supplied and they may be aiming to bring stocks closer to the 2019Q4 level (8000 million barrels in this scenario). Also note that stocks change very little from 2022Q3 ro 2023Q4 under the assumptions of this scenario.
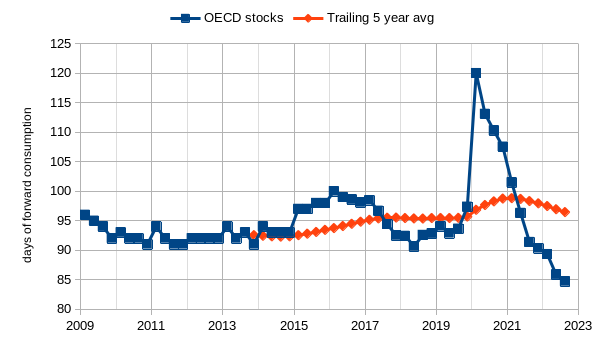
OECD stocks continue to be much lower than the 2009 to 2019 period, but OECD stocks seem to be playing a less important role in determining oil prices of late.
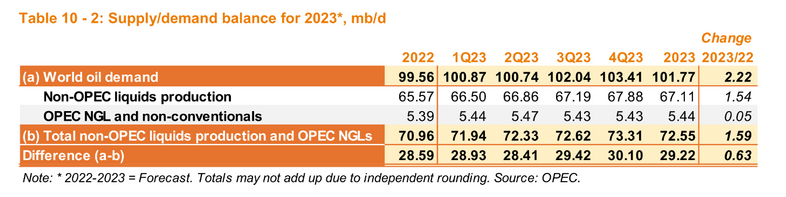
Below are OPEC’s forecast for Oil supply in 2022 and 2023, unfortunately they report in all liquids rather than C+C.
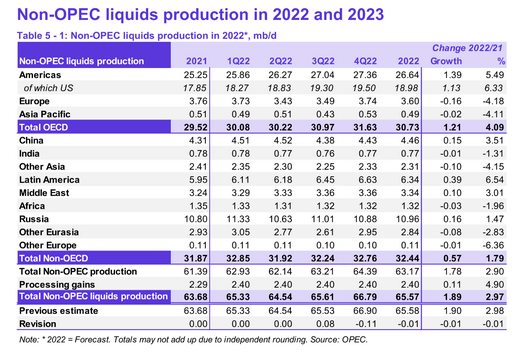
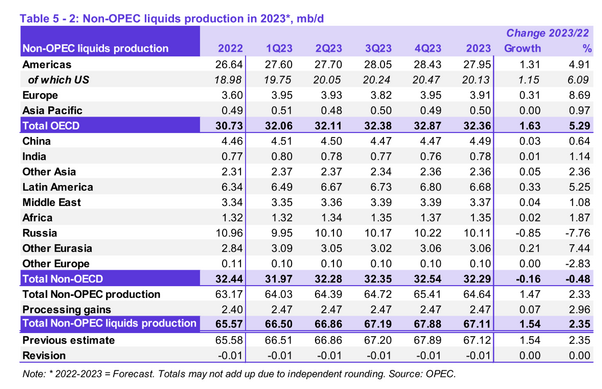
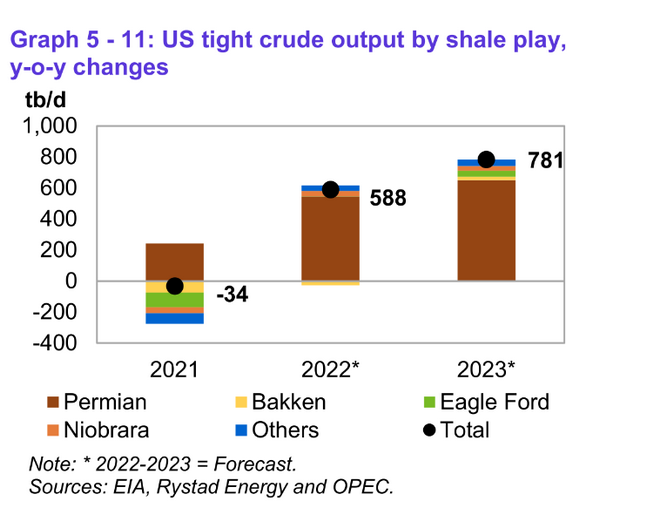
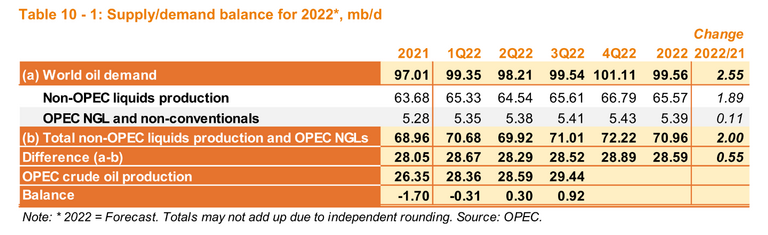
Of the 1.47 Mb/d of increased non-OPEC output that OPEC forecasts for 2023, 1.15 Mb/d is expected to come from the US, with increased output from Canada and Norway of 0.48 Mb/d combined, output falls in Russia by 0.85 Mb/d but this is offset by increases in other Non-OECD nations so that the total non-OECD decrease is 0.16 Mb/d. Of the 1.15 Mb/d increase in US output in 2023, 0.78 Mb/d is expected to be tight oil with NGL adding another 0.33 Mb/d.
The chart below gives more detail on OPEC’s forecast for US tight oil year over year increases from 2021 to 2023 for various tight oil plays.